First, we have to understand our demographics

One of the first steps on our Racial Equity journey was to commission hyper local analyses of Census Bureau data. Here is what BlackDemographics.com found:

The American Community survey collected data from 2013 - 2017 to create the following statistic information on the Belknap Lookout Neighborhood. As detailed in the following images 15% of this neighborhood is Black, 19% is Latino/Hispanic, 63% is white, and 3% is Asian American / Pacific Islander. The median household annual income in our neighborhood is nearly $57,000, while the median household income for Black households is about $23,000 and is about $18,000 for Latino/Hispanic households. 35% of the neighborhood lives in poverty- of that group 79% of our black neighbors and 56% of our Hispanic/Latino neighbors are living in poverty. While 31% of all neighbors are homeowners, only 3% of Black neighbors and 24% of Hispanic/Latino neighbors have homeownership. 39% of Black households and 53% of Hispanic/Latino households are single female-led families, while only 5% of households in each demographic are single male-led families.

Latino/Hispanic Demographic Profile

Information on this chart covered in previous image alt text.

Next, we dig into the “Life Areas”

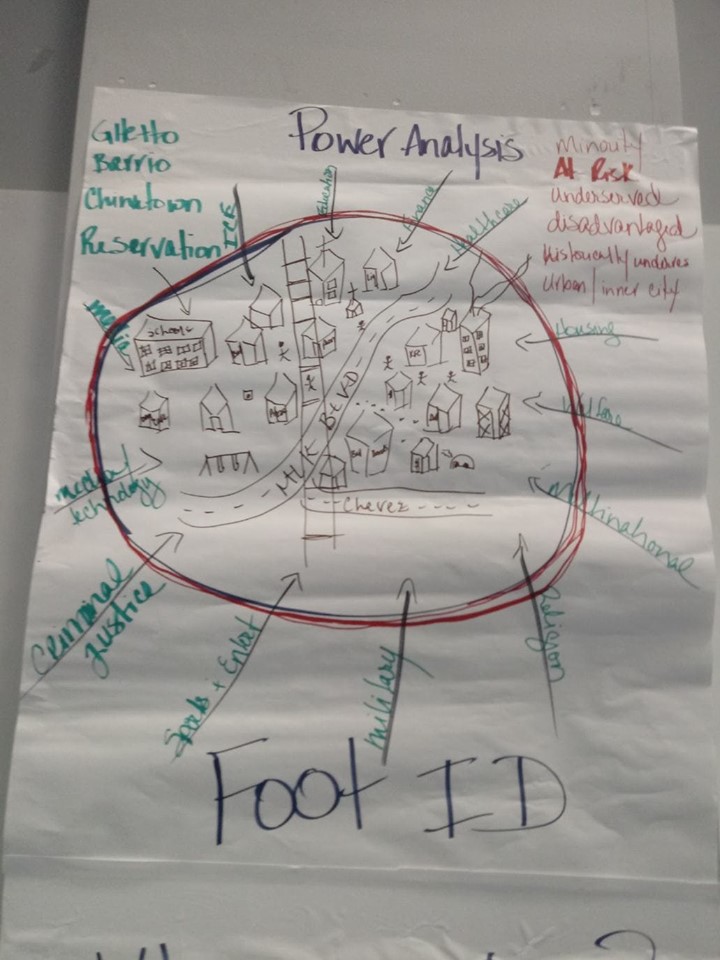
Then-Board Member Robin Benton asked us to describe a poor community. We saw physical characteristics and acknowledged the labels that are often put on these places and the people who live there.

Hand drawing of a community and the systems that surround it - identifying the feet of the power analysis.

Then we identified what systems exist that make an impact on them:

  • Health
  • Housing
  • Education
  • Criminal Justice
  • Environment
  • Social Services
  • Economics
  • Culture/Communication

This list led us to the power analysis. We conducted conversations on the first two systems. We used the following questions:

  • What entities affect life area/system x?
  • How does life area/system x work together with any other system?
  • How does life area/system x oppress, exploit, exclude or underserve poor communities?
View our Housing conversation results here

Sketch of Belknap Lookout with housing organizations identified in their approximate locationHousing Disparities are reflected in several areas- those being: Health- condition of your housing can impact your health Examples: exposure to lead, PFAS Education: where you live determines the quality of education you / your children will receive A low taxed area will not provide a robust and funded education because the residents of the neighborhood cannot afford to pay the high tax rates we see in schools located in affluent neighborhoods with many resources and highly funded education offered to their students. Environment: what is in the immediate surrounding location of your home that may decrease property value / desirability? Examples: Industrial park, liquor stores, railroads, highway overpasses, electrical lines/sourcing? Social Services: Housing arrangements impact eligibility for certain social services Economics: your economic status defines where your housing options are located, whether or not you would be eligible for home ownership. Home ownership serves as a pathway to building assets and gaining further financial security. List of ways in which the housing system oppresses, exploits and underserves poor communities.


Ultimately, former Intern Katlyn Johns conducted further research. She used all of the above information to create brochures on housing and health disparities.

In summer of 2022, we talked about education with the young people assigned to work for us from the City’s GRow 1000 program. One outcome of this discussion was an interview project completed by MSW Intern D’Angelo Starks. He asked neighbors to describe what they do for work, and shared those videos with elementary students at Coit Creative Arts Academy.

Translate »